

Despite Chicago’s population contraction since 2018, its central location makes it a powerhouse for distribution centers, bringing goods quickly and efficiently throughout the Midwest and North America. As the only U.S. metropolitan area to contain six Class 1 railroads, Chicago’s established network of highways and rail access make it top of mind for national and local developers alike.
While Chicago’s industrial market is cooling down from its white-hot performance achieved during the early years post-pandemic, tenant demand is proving more resilient here than in most major U.S. markets. The local vacancy rate stands at 4.5% during 23H2 and is tighter than the U.S. average, a position it will likely maintain in 2024 even as oncoming completions of speculative projects pushes the market’s vacancy rate slightly higher over the next six months.
A diverse range of 23Q3 move-ins by tenants across the market helped keep recent net absorption elevated, at 25 million SF over the past 12 months, on pace to only be behind 2021 and 2022. Concurring with this sentiment, although leasing volume is down from the highs set during the previous two years, Chicago’s industrial leasing volume is on par with the market’s average trajectory. Recent expansions include retailer Target (1.2 million SF) and cabinet supplier Wolf Cabinet (1 million SF) in the Joliet Area, plastic cup manufacturer Solo Cup (1 million SF) in the Near South Cook region, and 3PL provider RJW Logistics (628,000 SF) into the South I-55 Corridor. All of these properties delivered in 2022 and 2023.
“The higher cost of capital has led to less investment transaction volume; however, this has allowed more owner users to purchase assets to the right size their real estate needs. Due to changes within several industries, including transportation, we are seeing more available sublease space hit the market. The Chicago market is still going strong, but we are starting to see a slowdown in transaction volume compared to the previous few years.”
–Dustin Albers, Senior Associate.
Top Overall Chicago Industrial Real Estate Lease Statistics
12 Month Deliveries (Square Feet): 30.8 million (27. million in Q2 2023)
12 Month Net Absorption (Square Feet): 21.6 million (25.3 million in Q2 2023)
Vacancy Rate: 4.6% (4.0% in Q2 2023)
12 Month Rent Growth: 7.4% (8.0% in Q2 2023)
Top Chicago Industrial Leases (Past 12 Months)
1) Property: 101 W Compass Blvd
Submarket: Joliet Area
Leased SF: 1,218,120
Quarter: Q1 2023
Tenant: Target
Tenant Rep: N/A
Leasing Rep: CBRE
2) Property: 2250 Berens Ct
Submarket: Joliet Area
Leased SF: 1,159,200
Quarter: Q2 2023
Tenant: Unilever
Tenant Rep: N/A
Leasing Rep: Cushman & Wakefield
3) Property: 7450 McCormick Blvd
Submarket: North Cook
Leased SF: 1,052,637
Quarter: Q4 2022
Tenant: Tenneco, Inc.
Tenant Rep: N/A
Leasing Rep: N/A
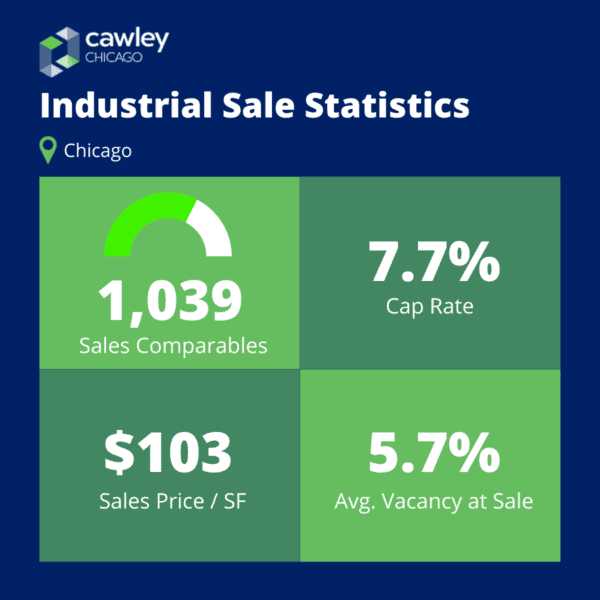
Top Chicago Industrial Sales Statistics (Past 12 Months)
Sales Comparables: 1,039 (1,197 in Q2 2023)
Average Cap Rate: 7.7% (7.7% in Q2 2023)
Average Price/ SF: $103 ($82 in Q2 2023)
Average Vacancy at Sale: 5.7% (4.8% in Q2 2023)
Top Chicago Industrial Property Sales
1) Property: CH2 Data Center (2299 Busse Rd)
*Rating: 4
Year Built: 2015
Building SF: 336,000
Vacancy: 0%
Price (PSF): $176,458,584 ($808)
Cap Rate: Not Listed
2) Property: CH1 Data Center (2200 Busse Rd)
*Rating: 3
Year Built: 1972
Building SF: 485,000
Vacancy: 0%
Price (PSF): $154,270,236 ($489)
Cap Rate: Not Listed
3) Property: CH3 Data Center (1400 E Devon Rd)
*Rating: 4
Year Built: 2018
Building SF: 305,000
Vacancy: 0%
Price (PSF): $152,221,180 ($768)
Cap Rate: Not Listed
*Rating is 1-5, 5 being the best
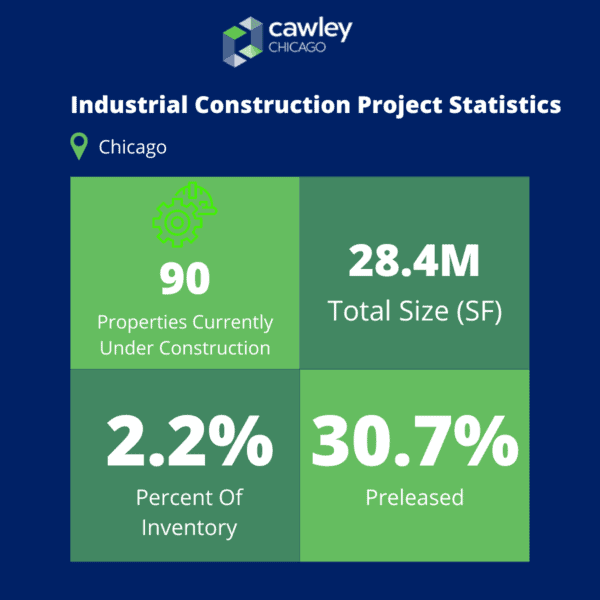
Chicago Industrial Construction Projects Statistics
Properties Currently Under Construction: 90 (105 in Q2 2023)
Total Size: 28.4 million (35.9 million in Q2 2023)
Percent of Inventory: 2.2% (2.8% in Q2 2023)
Preleased: 30.7% (31.3% in Q2 2023)
Top Chicago Industrial Projects Under Construction
1) Property: Minooka Distribution Center (11075 McLinden Rd)
Rating*: 5
Building SF:1,500,800
Stories: 1
Completion: Q4 2023
Developer/ Owner: Molto Properties / Walmart Inc.
2) Property: #2 (9850 Mississippi St)
Rating*: 4
Building SF: 1,380,000
Stories: 1
Completion: Q3 2023
Developer/ Owner: N/A / Nancy Sanders
3) Property: 1237 W Division St
Rating*: 4
Building SF: 1,184,800
Stories: 5
Completion: Q2 2024
Developer/ Owner: N/A / Logistics Property Company, LLC
*Rating is 1-5, 5 being the best
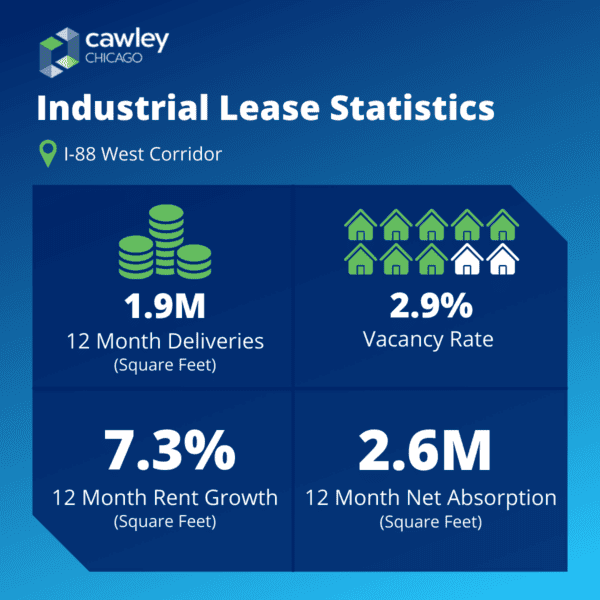
Top I-88 West Corridor Industrial Lease Statistics (Past 12 Months)
12 Month Deliveries (Square Feet): 1.9 million (1.4 million in Q2 2023)
12 Month Net Absorption (Square Feet): 2.6 million (2.7 million) in Q2 2023)
Vacancy Rate: 2.9% (3.1% in Q2 2023)
12 Month Rent Growth: 7.3% (7.9% in Q2 2023)
4 & 5 Star Industrial Properties Leasing Activity in I-88 West Corridor (Past 12 Months)
1) Property: 2800 W Diehl Rd
Rating: 5
Deals: 1
Square Feet: 392,973
Vacancy: 0%
Net Absorption: 392,973
2) Property: 175 Ambassador Dr
Rating: 4
Deals: 1
Square Feet: 306,000
Vacancy: 73.9%
Net Absorption: 306,000
3) Property: Prologis Aurora (701 Bilter Rd)
Rating: 5
Deals: 1
Square Feet: 162,018
Vacancy: 60%
Net Absorption: 162,018
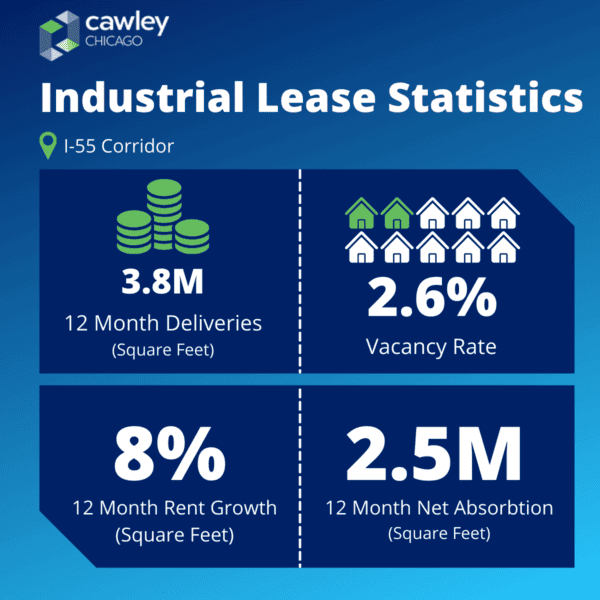
Top South I-55 Corridor Industrial Lease Statistics (Past 12 Months)
12 Month Deliveries (Square Feet): 3.8M (2.6M in Q2 2023)
12 Month Net Absorption (Square Feet): 2.5M (1M in Q2 2023)
Vacancy Rate: 2.6% (3.1% in Q2 2023)
12 Month Rent Growth: 8.0% (8.7% in Q2 2023)
4 & 5 Star Industrial Properties Leasing Activity in South I-55 Corridor (Past 12 Months)
1) Property: 555 S Pinnacle Dr
Rating: 5
Deals: 1
Square Feet: 795,965
Vacancy: 0%
Net Absorption: 795,965
2) Property: Building 1
Rating: 4
Deals: 1
Square Feet: 627,902
Vacancy: 0%
Net Absorption: 627,902
3) Property: Carlow XX
Rating: 4
Deals: 1
Square Feet: 321,132
Vacancy: 33.3%
Net Absorption: 321,132
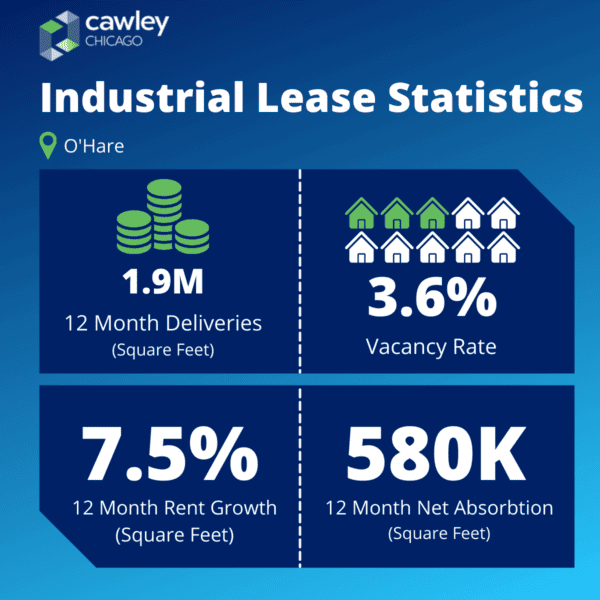
Top O’Hare Industrial Lease Statistics (Past 12 Months)
12 Month Deliveries (Square Feet): 1.9M (1.9M in Q2 2023)
12 Month Net Absorption (Square Feet): 508K (839K in Q2 2023)
Vacancy Rate: 3.6% (3.3% in Q2 2023)
12 Month Rent Growth: 7.5% (8.2% in Q2 2023)
4 & 5 Star Industrial Properties Leasing Activity in South O’Hare (Past 12 Months)
1) Property: Prologis Elk Grove Village
Rating: 5
Deals: 1
Square Feet: 268,494
Vacancy: 48.8%
Net Absorption: 163,875
3) Property: 700 Golf Ln
Rating: 4
Deals: 1
Square Feet: 144,704
Vacancy: 0%
Net Absorption: 124,257
3) Property: Building 8 (595-601 Supreme Dr)
Rating: 4
Deals: 2
Square Feet: 106,692
Vacancy: 20%
Net Absorption: 106,692
Top I-88 West Industrial Sales Statistics (Past 12 Months)
Sales Comparables: 55 (69 in Q2 2023)
Average Cap Rate: 7.5% (7.9% in Q2 2023)
Average Price/ SF: $72 ($78 in Q2 2023)
Average Vacancy at Sale: $8.6% (6.1% in Q2 2023)
Top I-88 West Industrial Real Estate Property Sales
1) Property: Butterfield I (2707 Eola Rd)
*Rating: 4
Year Built: 1997
Building SF: 252,946
Vacancy: 35.1%
Price (PSF): $21,000,000 ($83)
Cap Rate: Not Listed
2) Property: Butterfield Logistics Center (1103 Butterfield Rd)
*Rating: 5
Year Built: 2004
Building SF: 174,300
Vacancy: 57.4%
Price (PSF): $18,476,000 ($106)
Cap Rate: Not Listed
Top South I-55 Industrial Sales Statistics (Past 12 Months)
Sales Comparables: 27 (39 in Q2 2023)
Average Cap Rate: 6.3% (8.0% in Q2 2023)
Average Price/ SF: $112 ($111 in Q2 2023)
Average Vacancy at Sale: 1.2% (5.2% in Q2 2023)
Top South I-55 Industrial Real Estate Property Sales
1) Property: Bolingbrook Distribution
*Rating: 4
Year Built: 1994
Building SF: 320,168
Vacancy: 0%
Price (PSF): $31,000,000 ($97)
Cap Rate: 4.3%
2) Property: 1881 W Normantown Rd
*Rating: 5
Year Built: 2016
Building SF: 226,102
Vacancy: 0%
Price (PSF): $23,494,492 ($104)
Cap Rate: Not Listed
Top O’Hare Industrial Sales Statistics (Past 12 Months)
Sales Comparables: 118 (122 in Q2 2023)
Average Cap Rate: 6.6% (6.6% in Q2 2023)
Average Price/ SF: $287 ($89 in Q2 2023)
Average Vacancy at Sale: 2.0% (1.7% in Q2 2023)
Top O’Hare Industrial Real Estate Property Sales
1) Property: CH2 Data Center (2299 Busse Rd)
*Rating: 4
Year Built: 2015
Building SF: 336,000
Vacancy: 0%
Price (PSF): $176,458,584 ($808)
Cap Rate: Not Listed
2) Property: CH1 Data Center (2200 Busse Rd)
*Rating: 3
Year Built: 1972
Building SF: 485,000
Vacancy: 0%
Price (PSF): $154,270,236 ($489)
Cap Rate: Not Listed
3) Property: CH3 Data Center (1400 E Devon Rd)
*Rating: 4
Year Built: 2018
Building SF: 305,000
Vacancy: 0%
Price (PSF): $152,221,180 ($768)
Cap Rate: Not Listed
I-88 West Industrial Construction Projects Statistics
All-Time Annual Average Square Feet: 1,436,244 (1,361,252 in Q2 2023)
Delivered SF (Past 8 Qs): 3,034,550 (3,408,550 in Q2 2023)
Delivered SF (Next 8 Qs): 2,051,000 (3,459,000 in Q2 2023)
Proposed SF (Next 8 Qs): 4,863,261 (4,866,026 in Q2 2023)
Top I-88 West Industrial Projects Delivered
3) Property: Amazon (1401 E Gurler Rd)
Rating*: 4
Building SF: 700,000
Stories: 1
Completion: Q3 2023
Developer/ Owner: Krusinski Construction Company / N/A
2) Property: 4275 Ferry Rd
Rating*: 4
Building SF: 270,934
Stories: 1
Completion: Q2 2023
Developer/ Owner: Logistics Property Company, LLC
3) Property: Rod Baker Ford Dealership (13921 S Route 59)
Rating*: 3
Building SF: 55,000
Stories: 1
Completion: Q2 2023
Developer/ Owner: N/A / Ford
Top I-88 West Industrial Projects Under Construction
1) Property: Meta DeKalb Data Center (1550 Metaverse Way)
Rating*: 5
Building SF: 907,000
Stories: 1
Completion: Q2 2025
Developer/ Owner: N/A / Meta Platforms, Inc.
South I-55 Industrial Construction Projects Statistics
All-Time Annual Average Square Feet: 2,798,292 (2,767,488 in Q2 2023)
Delivered SF (Past 8 Qs): 6,306,150 (5,058,975 in Q2 2023)
Delivered SF (Next 8 Qs): 1,522,953 (2,777,040 in Q2 2023)
Proposed SF (Next 8 Qs): 1,184,861 (1,339,294 in Q2 2023)
Top South I-55 Industrial Projects Delivered
1) Property: Carlow XXII
Rating*: 4
Building SF: 321,132
Stories: 1
Completion: Q2 2023
Developer/ Owner: N/A
2) Property: Carlow XXI
Rating*: 4
Building SF: 220,620
Stories: 1
Completion: Q2 2023
Developer/ Owner: Northern Builders, Inc. / N/A
3) Property: Lindsey Lane Building 1
Rating*: 4
Building SF: 93,881
Stories: 1
Completion: Q2 2023
Developer/ Owner: ML Realty Partners LLC
Top South I-55 Industrial Projects Under Construction
1) Property: 185 Southcreek Pky
Rating*: 4
Building SF: 497,717
Stories: 1
Completion: Q4 2023
Developer/ Owner: N/A
O’Hare Industrial Construction Projects Statistics
All-Time Annual Average Square Feet: 720,124 (718,232 in Q2 2023)
Delivered SF (Past 8 Qs): 2,454,442 (2,611,386 in Q2 2023)
Delivered SF (Next 8 Qs): 241,741 (162,500 in Q2 2023)
Proposed SF (Next 8 Qs): 2,441,697 (2,550,938 in Q2 2023)
Top O’Hare Industrial Projects Delivered
1) Property: 790 N Central Ave
Rating*: 2
Building SF: 30,000
Stories: 1
Completion: Q2 2023
Developer/ Owner: N/A / City of Wolfdale
2) Property: Bridge Point Elk Grove I
Rating*: 4
Building SF: 147,066
Stories: 1
Completion: Q2 2023
Developer/ Owner: Bridge Industrial
3) Property: Bridge Point Elk Grove II
Rating*: 4
Building SF: 60,834
Stories: 1
Completion: Q2 2023
Developer/ Owner: Bridge Industrial
Top O’Hare Industrial Projects Under Construction
1) Property: 1460 W Thorndale Ave
Rating*: 4
Building SF: 132,500
Stories: 1
Completion: Q4 2023
Developer/ Owner: N/A
Data Sources: Cawley Commercial Real Estate & CoStar